Key Takeaways
- Market structure is the pattern of highs and lows that price makes — it is the foundation every other trading concept is built on top of.
- Three states exist: uptrend (higher highs, higher lows), downtrend (lower highs, lower lows), and range (sideways).
- If you cannot read market structure, every other concept — order blocks, liquidity, fair value gaps — is being applied blindly.
- Reading structure correctly tells you the trend direction, which is the single most important piece of information before any trade.
- Structure is simple to understand but takes real screen time to read fluently in live markets — like every skill, knowing it and mastering it are different.
Every trading concept you have heard of — order blocks, liquidity, fair value gaps, kill zones, smart money — sits on top of one foundation. And almost every beginner skips straight past it to chase the exciting concepts, which is exactly why their trading falls apart. That foundation is market structure.
Here is the uncomfortable truth: if you cannot read market structure fluently, everything else you learn is being applied blindly. You can mark a perfect order block, but if you do not know whether the market is trending up or down, you are guessing about direction. You can spot a liquidity sweep, but without structure you do not know which way the real move should go. Market structure is the skeleton. Every other concept is just muscle hanging on that skeleton — and without the skeleton, none of it holds together.
This guide explains what market structure actually is, in the simplest possible terms, and shows you why mastering it changes how you see every chart you will ever look at. Plain language, no jargon without explanation, built for someone starting from the ground up. This is the foundation. Get this right, and everything else gets easier. Let us get into it.
What Is Market Structure — In Plain English?
Let us define it as simply as possible.
Market structure is the pattern of highs and lows that price creates as it moves — and that pattern tells you what the market is doing.
According to Investopedia, market structure refers to the organizational characteristics of how a market behaves. For a trader, it comes down to something very visual and very simple: price never moves in a straight line. It moves in waves — pushing up, pulling back, pushing up again, or pushing down, bouncing, pushing down again. These waves create peaks and valleys on the chart.
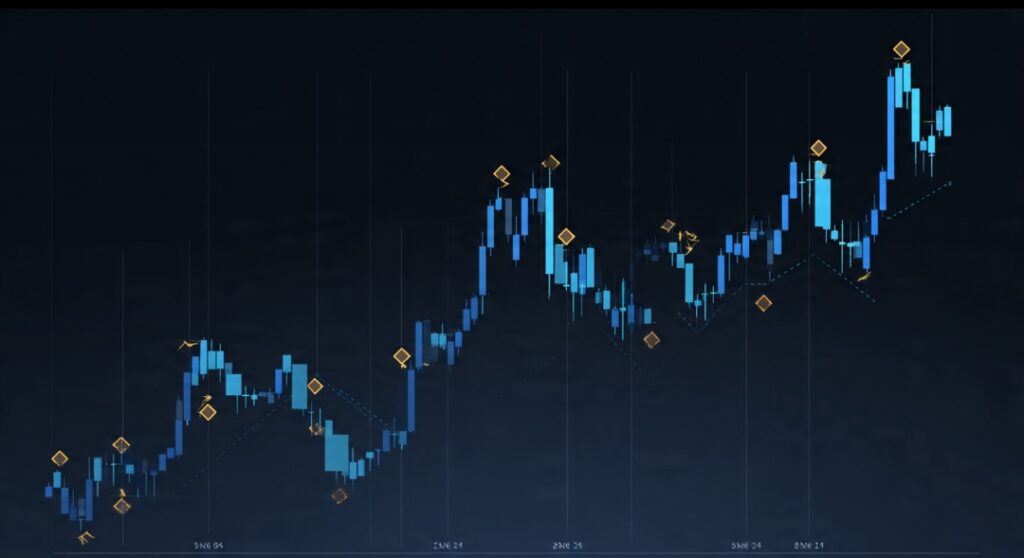
Those peaks are called swing highs, and those valleys are called swing lows. A swing high is a peak where price topped out before pulling back. A swing low is a valley where price bottomed out before bouncing back up. Market structure is simply the relationship between these swing highs and swing lows over time.
And here is why it matters so much: by reading how these highs and lows relate to each other, you can instantly tell whether the market is going up, going down, or going nowhere. That single piece of information — the direction — is the most important thing you can know before placing any trade. Everything starts here. This is the price action foundation that all other concepts build on. For the broader framework, read our beginner guide on what ICT concepts are in forex trading.
— Data Pips Team
The Three States of Market Structure
At any moment, a market is in one of three states. Learn to recognize these three, and you have learned the core of market structure.
1. Uptrend (Bullish Structure)
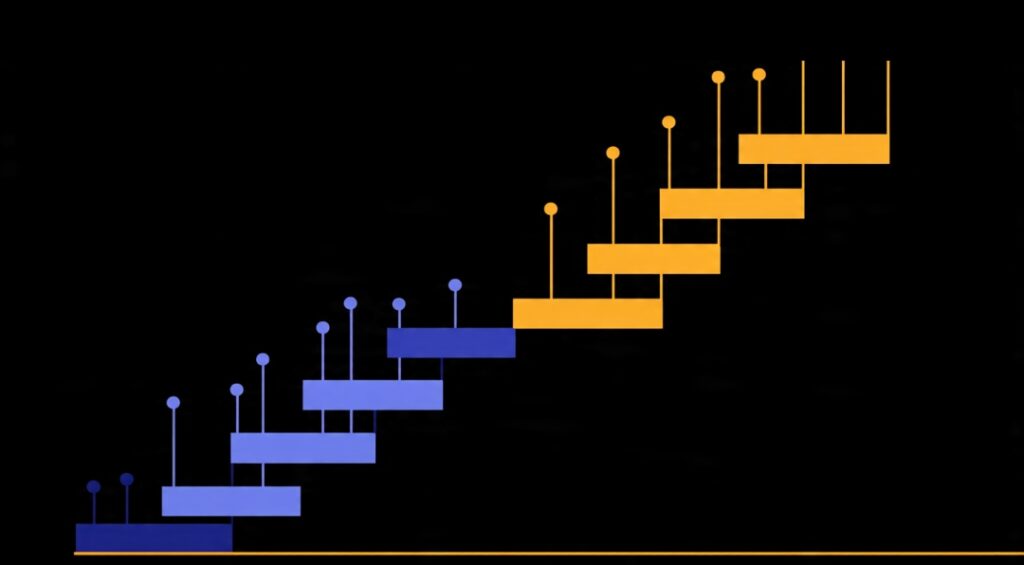
An uptrend is when price makes higher highs and higher lows. Each peak is higher than the previous peak, and each valley is higher than the previous valley. Picture a staircase going up — every step is higher than the one before. When you see this pattern, the market is in an uptrend, and the path of least resistance is upward. In an uptrend, you look for opportunities to buy, trading in the direction of the climb.
2. Downtrend (Bearish Structure)
A downtrend is the mirror image: price makes lower highs and lower lows. Each peak is lower than the previous peak, and each valley is lower than the previous valley. Picture a staircase going down — every step is lower than the one before. When you see this pattern, the market is in a downtrend, and the path of least resistance is downward. In a downtrend, you look for opportunities to sell, trading in the direction of the descent.
3. Range (Sideways / Consolidation)
A range is when price moves sideways, without making clear higher highs or lower lows. Price bounces between a rough ceiling (resistance) and a rough floor (support), going nowhere in particular. This is the market resting, consolidating, building up energy before its next directional move. Ranges are generally trickier and less rewarding to trade than clean trends, and many traders prefer to wait for the range to break into a clear trend before acting.
That is the entire foundation of trend reading. Higher highs and higher lows mean up. Lower highs and lower lows mean down. Sideways with no clear progression means range. The trend is your single most important piece of context — and reading these three states is how you identify it. Once you can glance at a chart and instantly say “this is an uptrend” or “this is a range,” you have crossed the most important threshold in technical trading.
How to Actually Read Structure on a Chart
Knowing the definitions is one thing. Here is how you practically read structure on a live chart, step by step.
Step 1: Identify the Swing Highs and Swing Lows
Look at the chart and mark the obvious peaks (swing highs) and obvious valleys (swing lows). Focus on the clear, significant ones — not every tiny wiggle. These swing points are the building blocks of structure. Getting good at identifying which highs and lows actually matter is the first real skill, and it takes practice.
Step 2: Compare Each High and Low to the Previous One
Now ask: is each new high higher or lower than the previous high? Is each new low higher or lower than the previous low? If highs and lows are both rising, you are in an uptrend. If both are falling, you are in a downtrend. If they are flat and overlapping, you are in a range. This comparison is the core mechanical act of reading structure.
Step 3: Watch for the Structure to Break
Once you know the current structure, watch for it to break — which signals either continuation or reversal. When price breaks a high or low in the trend’s direction, the trend continues (a Break of Structure). When price breaks against the trend for the first time, the trend may be reversing (a Change of Character). These two events — BOS and CHoCH — are how you track structure as it evolves. Our dedicated guide on BOS vs CHoCH covers these in full detail, and they are essential to mastering structure in motion.
Step 4: Read Structure on Multiple Timeframes
This is where it gets powerful. The same market can be in an uptrend on the higher timeframe but a downtrend on a lower timeframe — these are different “zoom levels” of structure. The higher timeframe structure is the dominant, more reliable one. Always establish the bigger picture from higher timeframes first, then zoom in to lower timeframes for precise entries. Beginners who only look at one timeframe constantly get confused when the lower timeframe contradicts the bigger trend.
Real Pattern: Why Structure Saves Trades
Consider a beginner who spots a beautiful bullish order block on Gold and gets excited to buy. The setup looks perfect on its own. But they never checked the market structure first.
Had they read the structure, they would have seen that the higher timeframe was in a clear downtrend — lower highs and lower lows, descending steadily. Their “perfect” bullish order block was a counter-trend setup, fighting against the dominant direction. They buy, and price briefly ticks up before the downtrend resumes and stops them out.
Now consider a trader who checks structure first. They see the downtrend, recognize that the market’s dominant direction is down, and instead of buying the bullish order block, they wait for a bearish setup aligned with the downtrend. When a bearish order block forms in line with the lower-high, lower-low structure, they sell — and ride the trend down profitably.
Lesson: The same concepts produced opposite results, and the difference was entirely market structure. Reading the trend first told one trader to avoid a bad counter-trend buy and told the other to take a high-probability trend-aligned sell. Structure is the filter that keeps you on the right side of the market.
Why Market Structure Is the Most Important Concept
Here is the claim, and it is not exaggeration: market structure is more important than any other trading concept you will learn. Here is why.
Every other concept depends on structure for its meaning. An order block is only useful if you know whether to look for bullish or bearish setups — which structure tells you. A liquidity sweep only makes sense in the context of which direction the real move should go — which structure tells you. A fair value gap is only a good entry if it aligns with the trend — which structure tells you. Strip away structure, and every other concept becomes a coin flip, because you have no idea which direction to favor.
This is why the Data Pips Team emphasizes structure above all else for beginners. Traders who skip structure and jump straight to the exciting concepts — order blocks, liquidity grabs, fancy entry models — build their house on sand. They take great-looking setups in the wrong direction and wonder why they keep losing. The setups were fine. The structural context was ignored.
Master structure, and you gain the single most valuable filter in trading: the ability to know, at a glance, which direction the market favors. With that filter in place, every other concept becomes dramatically more reliable, because you are only taking setups that align with the dominant trend. Trading with the trend instead of against it is the difference between fighting the current and swimming with it.

Where Beginners Go Wrong With Market Structure
They Skip It Entirely
The biggest mistake. Beginners are drawn to the exciting, named concepts — order blocks, liquidity sweeps — and treat boring old structure as something they can ignore. Then they take setups without knowing the trend, get the direction wrong half the time, and never understand why. Structure is not optional. It is the first thing to check on every chart, before any other concept.
They Mark Every Tiny Wiggle as a Swing Point
On lower timeframes, price makes countless tiny highs and lows, and beginners try to treat every one as significant structure. This creates a confusing mess of contradictory signals. The skill is identifying the meaningful swing points — the clear, obvious peaks and valleys that actually matter — and ignoring the noise. Focus on significant structure, not every minor fluctuation.
They Only Look at One Timeframe
A trader who only looks at, say, the 5-minute chart sees the structure on that timeframe but misses the bigger picture. They might trade a 5-minute uptrend straight into a daily downtrend, getting run over by the dominant direction they never checked. Always read the higher timeframe structure first to establish the dominant trend, then use lower timeframes for entries within that context.
They Think Reading Structure Is Enough on Its Own
The familiar deepest trap. Understanding market structure feels like a breakthrough — and it is, as the foundation. But reading structure correctly in real time and trading it profitably are different skills. The Data Pips Team has seen countless traders who can identify trends perfectly in hindsight, yet still lose money, because real-time structure reading under pressure, combined with the discipline to actually trade with the trend instead of against it, is a skill that only experience builds. Structure gives you the direction; your discipline determines whether you can act on it. Our guide on mechanical discipline covers the work that turns knowledge into results.
— Data Pips Team
The Truth About Market Structure Nobody Tells Beginners
1. Identifying Swing Points Involves Judgment
Here is something rarely admitted: deciding which highs and lows count as significant swing points is partly subjective, and different traders will mark them slightly differently. This is normal. There is no single perfect way to mark structure. What matters is developing a consistent method that YOU apply the same way every time, so your reading is reliable for you. Consistency matters more than finding the one “correct” interpretation, which does not really exist.
2. The Higher Timeframe Always Wins the Argument
When timeframes disagree — the 5-minute says up, the daily says down — the higher timeframe is more reliable and more dominant. Beginners who trade the lower timeframe structure while ignoring the higher timeframe get whipsawed constantly. Always anchor your bias to the higher timeframe. The lower timeframe is for refining entries within the higher timeframe’s direction, not for setting your overall direction.
3. Structure Looks Obvious in Hindsight, Messier Live
Scrolling back through charts, the trend looks perfectly clear — you can see exactly where the uptrend was and where it reversed. In real time, at the right edge of the chart, structure is messier and less certain. You do not always know whether the latest move is a normal pullback within the trend or the start of a reversal. This gap between hindsight clarity and real-time uncertainty is why structure feels easy to learn but takes real practice to read fluently.
4. Ranges Trap More Beginners Than Trends
Clean trends are relatively forgiving — trade with the direction and you have an edge. Ranges are where many beginners lose, because the choppy, directionless movement creates false signals constantly and there is no clear trend to align with. Many experienced traders simply avoid trading inside ranges, waiting instead for the range to break into a clear trend. If you are unsure whether the market is trending or ranging, the safest assumption is often that it is ranging — and ranging markets are best treated with caution.
5. This Foundation Will Not Save You Without Discipline
The familiar hard truth. Mastering market structure gives you the most important filter in trading — but it does not give you discipline, risk management, or emotional control. A trader who reads structure perfectly but oversizes positions, revenge trades, or abandons their plan still loses. Structure is the foundation of good analysis. Discipline is the foundation of good execution. You need both, and structure alone is not enough.
Your Market Structure Practice Plan
Now It’s Your Move
- Learn to spot swing highs and swing lows. Open any chart and practice marking the clear peaks and valleys. This is the building block of everything. Do it until it is automatic.
- Identify the three states instantly. Practice glancing at charts and saying “uptrend,” “downtrend,” or “range” within seconds. Higher highs and lows = up. Lower highs and lows = down. Sideways = range.
- Always read structure before any other concept. On every chart, establish the trend first. Only then look at order blocks, liquidity, or entries. Structure is the first checkpoint, always.
- Read higher timeframes first. Establish the dominant trend from higher timeframes, then zoom into lower timeframes for entries. The higher timeframe always wins.
- Practice in hindsight, then in real time. First trace structure on historical charts. Then practice reading it live, where it is messier — this is where the real skill develops.
- Trade with the trend, not against it. Once you know the structure, only take setups aligned with the dominant direction. Swimming with the current beats fighting it.
- Be cautious in ranges. If the market is not in a clear trend, be careful. Many traders wait for ranges to break into trends before acting. When in doubt, assume range and trade lightly.
Frequently Asked Questions
Market structure is the pattern of highs and lows that price creates as it moves, and that pattern reveals what the market is doing. Price moves in waves, creating peaks (swing highs) and valleys (swing lows). By reading the relationship between these highs and lows, you can tell whether the market is in an uptrend (higher highs and higher lows), a downtrend (lower highs and lower lows), or a range (sideways). Market structure is the foundation that every other trading concept — order blocks, liquidity, fair value gaps — is built upon, because it tells you the all-important trend direction.
Market structure is the single most important concept because every other concept depends on it for meaning. An order block, a liquidity sweep, or a fair value gap is only useful if you know which direction the market favors — and structure provides that direction. Without reading structure, you are essentially guessing whether to buy or sell, which turns every setup into a coin flip. Mastering structure gives you the ability to know at a glance which direction the market favors, so you only take trades aligned with the dominant trend. This is why traders who skip structure and chase exciting concepts consistently struggle.
The three states of market structure are: Uptrend, where price makes higher highs and higher lows (like a staircase climbing up), signaling you should look to buy; Downtrend, where price makes lower highs and lower lows (a staircase descending), signaling you should look to sell; and Range, where price moves sideways between a rough ceiling and floor without clear directional progression, which is the market consolidating. Recognizing which of these three states the market is in is the core skill of reading structure, and it is the first thing to determine on any chart before placing a trade.
Start by marking the clear swing highs (obvious peaks) and swing lows (obvious valleys) on a chart, focusing on significant ones rather than every tiny wiggle. Then compare each high and low to the previous one: if both are rising, it is an uptrend; if both are falling, it is a downtrend; if they are flat and overlapping, it is a range. Next, watch for the structure to break, which signals continuation or reversal. Finally, read structure on higher timeframes first to establish the dominant trend, then zoom into lower timeframes for entries within that context.
A swing high is a peak on the chart where price topped out before pulling back down — the high point of an upward wave. A swing low is a valley where price bottomed out before bouncing back up — the low point of a downward wave. These swing highs and swing lows are the building blocks of market structure. By comparing each swing high and swing low to the previous ones, you determine the trend: rising swing highs and lows indicate an uptrend, while falling swing highs and lows indicate a downtrend. Identifying the meaningful swing points is the first practical skill in reading structure.
For most beginners, waiting for a clear trend is safer than trading inside a range. Ranges are choppy and directionless, creating false signals constantly, and they trap many beginners who keep getting whipsawed. Clean trends are more forgiving because you have a clear direction to align with. Many experienced traders simply wait for a range to break into a clear trend before taking trades. If you are unsure whether the market is trending or ranging, the safer assumption is often that it is ranging, and ranging markets are best approached with extra caution or avoided until a clear trend emerges.
Yes, market structure applies to all timeframes — but the same market can show different structure on different timeframes, which is crucial to understand. A market might be in an uptrend on the daily chart but a downtrend on the 5-minute chart, since these are different “zoom levels.” The higher timeframe structure is the more dominant and reliable one. The best practice is to always establish the dominant trend from higher timeframes first, then use lower timeframes only to refine your entries within that higher timeframe direction. Reading multiple timeframes together gives you the complete structural picture.

Now It’s Your Move
Every exciting concept you have chased — order blocks, liquidity sweeps, fair value gaps, kill zones — sits on top of this one foundation. Market structure is the skeleton. It is the pattern of highs and lows that tells you, before anything else, whether the market is climbing, falling, or going nowhere. And that single piece of information — the direction — is the most valuable thing you can know before any trade.
Higher highs and higher lows mean up. Lower highs and lower lows mean down. Sideways with no clear progression means range. That is the entire foundation, and once you can read it at a glance, every other concept becomes dramatically more reliable, because you are finally trading with the market’s direction instead of guessing.
The beginners who struggle are the ones who skipped this — who chased the exciting concepts and never learned to read the trend. They take great-looking setups in the wrong direction and never understand why they fail. Do not be one of them. Make structure the first thing you check on every chart, always, before anything else.
And remember the deeper truth: reading structure is the foundation of good analysis, but discipline is the foundation of good execution. Knowing the trend will not save you if you cannot trade with the discipline to act on it. Master both — the structure that tells you the direction, and the discipline that lets you follow it.
Learn to mark swing points. Identify the three states instantly. Read higher timeframes first. Trade with the trend. Practice until structure reading is automatic. This is the foundation everything else is built on — get it right, and the whole game gets easier.
You now understand the foundation that most beginners never properly learn. Build everything else on top of it.
For your next steps, learn how structure breaks and shifts with our guide on BOS vs CHoCH, then layer on the entry concepts: order blocks and liquidity sweeps. Tie it all together with our complete ICT trading strategy guide.