- Price does not move randomly — it moves from one pool of liquidity to another, and understanding this single idea reframes how every chart should be read.
- The Power of Three (Accumulation, Manipulation, Distribution) explains the life cycle of nearly every daily candle and trading session.
- Knowing the correct direction is only half the equation — entry models built on displacement and Fair Value Gaps determine your actual risk-to-reward.
- None of these concepts matter without the discipline to master one model and stay consistent, rather than chasing every new pattern.
Understanding how price genuinely moves is the difference between a trader who struggles indefinitely and one who reaches real consistency. The Inner Circle Trader, or ICT, methodology — built on the principles of institutional order flow and market efficiency — has reshaped how serious retail traders interpret price charts, moving them away from lagging indicators and toward the actual mechanics of how large market participants operate.
This guide from the Data Pips Team breaks down the core ICT pillars — liquidity, market structure, displacement, and the Power of Three — into a practical framework you can actually apply, rather than a collection of jargon that sounds impressive but never translates into real trades.

The Foundation: Understanding Liquidity
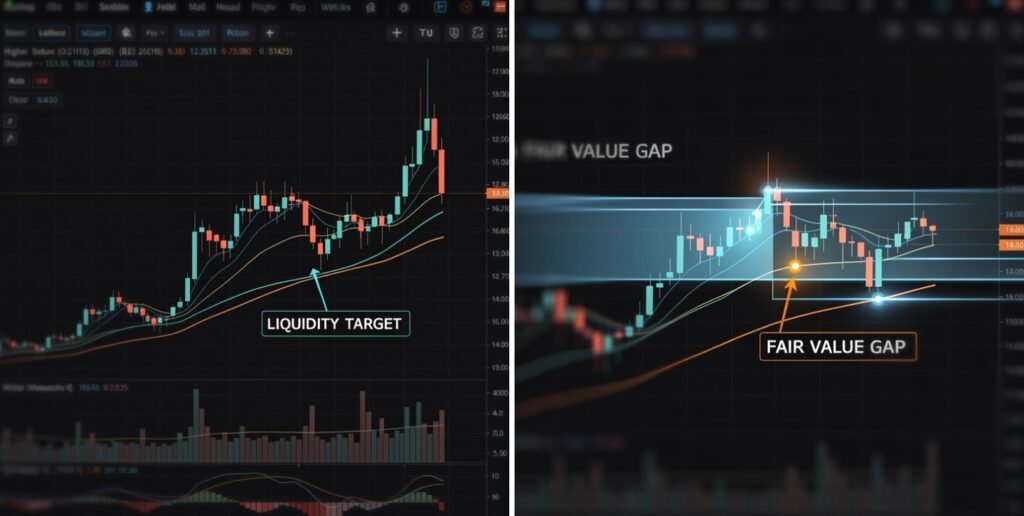
Price does not move randomly across a chart. It moves from one pool of liquidity to another, where liquidity represents clusters of stop orders placed by market participants at predictable levels — swing highs, swing lows, and the edges of recent price ranges.
Investopedia’s definition of liquidity describes it as how easily an asset can be bought or sold without significantly affecting its price — and in ICT methodology, this concept extends specifically to where large clusters of orders sit waiting to be triggered, which is exactly where institutional players often direct price before reversing.
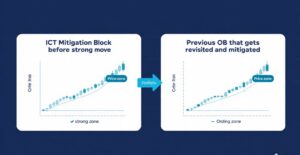
Two specific types of liquidity matter most for reading a chart correctly. External Range Liquidity, often shortened to ERL, refers to swing highs and swing lows — levels where price frequently moves to “purge” resting stop orders before reversing direction. Internal Range Liquidity, or IRL, refers to the imbalances found within Fair Value Gaps, where price often returns to rebalance the market before continuing in its original direction. Our complete guide on order blocks and fair value gaps covers this second concept in significant additional detail.
A useful mental model: think of price as a magnet moving between an internal liquidity gap and an external liquidity target, repeatedly cycling between the two as the broader trend develops.
Market Structure and Displacement
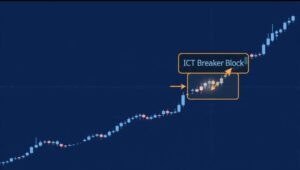
Identifying a genuinely high-probability setup requires looking specifically for displacement — a powerful, energetic price move that leaves behind a visible Fair Value Gap as evidence of its force. Displacement is the signature of real institutional participation, as opposed to slow, gradual price drift that carries far less conviction.
A Market Structure Shift, commonly abbreviated as MSS, occurs when price breaks a significant swing point with this kind of displacement, signaling a genuine change in trend direction rather than a temporary fluctuation. The defining signature of a valid shift is specific: price must close beyond the previous structural point and create a new Fair Value Gap in the process. Without that displacement and resulting gap, what looks like a structure break is often nothing more than a liquidity grab — a brief manipulation designed to trigger stops before reversing back in the original direction.
“Trading ICT concepts is not about memorizing patterns. It is about understanding why and where price is genuinely likely to go next.”
— Data Pips Team
The Power of Three: Reading the Life Cycle of Price
The Power of Three, often abbreviated PO3, is a conceptual framework explaining the predictable life cycle of a daily candle or a specific trading session. It breaks down into three distinct phases that repeat constantly across different timeframes.
Accumulation. The market moves sideways within a relatively tight range while larger market participants quietly build positions, without revealing clear directional intent through obvious price movement.
Manipulation. Price moves in the opposite direction of the eventual true trend — frequently called the “Judas Swing” — specifically to trap retail traders positioned against the coming move and engineer the liquidity needed to fuel it.
Distribution. The genuine trend unfolds as price moves aggressively and directionally toward the actual target liquidity, often with the strong displacement characteristic of real institutional participation.
| PO3 Phase | What It Looks Like | Trader Action |
|---|---|---|
| Accumulation | Sideways, tight-range movement | Observe, avoid forcing entries |
| Manipulation | Sharp move against the eventual trend | Identify the liquidity grab, avoid chasing it |
| Distribution | Strong directional move with displacement | Look for entry on the retracement into the new gap |

High-Probability Entry Models
Knowing the correct directional bias is only half of what determines a trade’s outcome. The specific entry model used defines the actual risk-to-reward available on that trade, which is exactly why entry precision deserves as much attention as directional analysis.
The Inverted Fair Value Gap. When a Fair Value Gap that was expected to act as resistance gets closed through decisively, it frequently flips and begins acting as support instead — and the reverse holds true as well. This flip is a strong signal of a genuine trend shift rather than a temporary pause.
Change in State of Delivery, or CISD. This marks the specific moment price action clearly transitions from being controlled by sellers to being controlled by buyers, commonly identified through an engulfing move that closes beyond a previous array of down-close candles.
A common high-probability entry sequence combines these elements: price first taps a higher timeframe key level, followed by a liquidity grab that manipulates retail positioning, then a strong displacement confirming a market structure shift, with the actual entry taken at the resulting Fair Value Gap. Our complete guide on mastering ICT and Smart Money Concepts expands on building this exact sequence into a repeatable trading process.
The Founder’s Real Lesson: Timeframe Alignment Changes Everything
One of the most common, most expensive mistakes among traders applying ICT concepts is ignoring higher timeframe context entirely while focusing exclusively on lower timeframe entries. A technically perfect lower timeframe setup against the wrong higher timeframe direction consistently underperforms a less precise entry that aligns correctly with the broader structural bias.
Years of trading gold and forex reinforced this hierarchy directly: identify directional bias and key liquidity targets on a higher timeframe first, then drop down to a lower timeframe specifically to refine entry timing around displacement and Fair Value Gaps within that already-established bias. Reversing this order — starting from lower timeframe excitement and only checking higher timeframe context afterward — consistently produces lower-quality trades, regardless of how clean the lower timeframe pattern looks in isolation.
Early application of ICT concepts repeatedly involved spotting an exciting-looking displacement and Fair Value Gap on a lower timeframe, taking the entry immediately, and only checking the higher timeframe structure afterward — usually after the trade had already failed. Reviewing a journal of these specific losses revealed a clear pattern: the lower timeframe setups that failed were almost always fighting against an unresolved higher timeframe liquidity target in the opposite direction. Reversing the process — establishing higher timeframe bias first, then refining entries only within that bias — eliminated the majority of these specific losses without changing the underlying entry model at all.
Why Technical Mastery Alone Is Never Enough
A complete understanding of liquidity, market structure, and the Power of Three still requires the same underlying discipline that any trading approach demands. Three principles consistently determine whether this technical knowledge actually translates into results.
Discipline outranks strategy quality. A trader’s daily loss and profit cutoff discipline matters more than even a highly accurate strategy, because no entry model survives an account blown through abandoned risk management.
Stop-loss is non-negotiable. Trading without a defined stop-loss might sustain a trader briefly, but human psychology genuinely cannot handle large, uncontrolled fluctuations over an extended period without eventually making a catastrophic decision.
Stick to one process long enough to evaluate it properly. Backtest and forward-test a single ICT-based approach for two to three months on a demo account before committing live capital. Investopedia’s explanation of backtesting confirms this is the standard method for evaluating whether a strategy is genuinely sound before real capital gets exposed to it. If that approach proves profitable in forward testing, any subsequent live losses are far more likely to stem from emotional execution issues than from the underlying technical model itself. Our complete guide on building mechanical discipline covers exactly how to address that execution gap once the technical foundation is solid.
What Nobody Tells You About ICT Trading Concepts
1. Not every liquidity grab leads to a valid reversal. Many traders treat every stop run as an automatic reversal signal. In reality, a genuine reversal requires the displacement and structural break that follows the grab — the grab itself is only the first half of a complete, valid setup.
2. ICT terminology can become a substitute for genuine understanding. It is possible to memorize the vocabulary — ERL, IRL, MSS, CISD — without genuinely understanding why each concept reflects real institutional behavior. Traders who treat these as a checklist rather than a coherent model of market behavior tend to misapply them in situations where the underlying logic does not actually hold.
3. Risk-reward ratio still determines profitability, regardless of entry precision. Even a textbook-perfect ICT entry needs an appropriate risk-reward structure to be worthwhile. Investopedia’s explanation of risk-reward ratio reinforces that consistently targeting favorable ratios remains essential, no matter how refined the entry methodology becomes.
4. The Power of Three does not play out identically every single session. Treating PO3 as a guaranteed daily pattern rather than a probabilistic tendency leads to forced trades on days where accumulation extends longer than expected or manipulation fails to produce a clear distribution phase. Flexibility within the framework matters as much as understanding the framework itself.
5. Higher timeframe context is the most commonly skipped step, despite being the most important one. New traders consistently gravitate toward lower timeframe excitement because entries appear more frequently and feel more immediately actionable. The traders who develop real consistency are usually the ones who slow down enough to establish higher timeframe bias first, even though it feels less immediately rewarding.
Aligning HTF Liquidity With LTF Precision
Mastering ICT concepts ultimately comes down to combining higher timeframe liquidity targets with lower timeframe displacement to align with institutional order flow and trade along the path of least resistance, rather than fighting against it. This is not about memorizing an exhaustive list of patterns — it is about consistently asking why price is likely headed toward a specific level and where the highest-probability entry within that move actually sits.
Session timing also plays a meaningful role in how cleanly these concepts play out. Our guide on ICT New York session theory covers exactly how specific trading windows tend to produce cleaner, more reliable institutional order flow for applying this framework.
Discipline remains the bridge between understanding these concepts intellectually and actually profiting from them consistently. Our complete guide on treating trading as a business rather than a lottery reinforces exactly this principle — master one model, apply it consistently, and let the underlying math compound over a meaningful sample of trades.
Quick Action Steps: Apply ICT Concepts to Your Charts This Week
Step 1: Pull up a higher timeframe chart and identify the most recent clear liquidity target — a significant swing high or swing low price has not yet reached.
Step 2: Mark the last three instances of displacement on that higher timeframe and confirm whether each one produced a genuine Market Structure Shift with a new Fair Value Gap.
Step 3: Drop to a lower timeframe only after establishing this higher timeframe bias, and look specifically for entries within that established direction.
Step 4: Practice identifying the three Power of Three phases on the last five trading sessions, noting where accumulation, manipulation, and distribution actually occurred.
Step 5: Backtest this complete sequence — HTF bias, liquidity grab, displacement, FVG entry — for at least 30 historical setups before applying it with live capital.
Frequently Asked Questions
What does ICT stand for in trading?
ICT stands for Inner Circle Trader, a methodology built around institutional order flow concepts including liquidity, market structure, displacement, and the Power of Three. It focuses on understanding how large market participants move price rather than relying on traditional lagging indicators.
What is the difference between External Range Liquidity and Internal Range Liquidity?
External Range Liquidity refers to swing highs and swing lows where stop orders cluster, often targeted before a reversal. Internal Range Liquidity refers to imbalances found within Fair Value Gaps, where price often returns to rebalance the market before continuing its original trend.
What is the Power of Three in ICT trading?
The Power of Three describes the typical life cycle of a daily candle or trading session through three phases: accumulation, where the market moves sideways while positions are built; manipulation, where price moves against the eventual trend to trap traders; and distribution, where the genuine trend unfolds aggressively toward the target liquidity.
Why is higher timeframe analysis important in ICT trading?
Higher timeframe analysis establishes the genuine directional bias and key liquidity targets that lower timeframe entries should align with. Entries taken on lower timeframes without this higher timeframe context frequently fail because they fight against an unresolved higher timeframe liquidity target.
What is displacement in ICT trading?
Displacement refers to a powerful, energetic price move that creates a Fair Value Gap and signals genuine institutional participation. It is the key distinguishing factor between a valid market structure shift and a temporary liquidity grab that lacks real conviction behind it.
Do ICT concepts work on all markets, or just forex and gold?
These concepts are most reliable in deep, liquid markets like major forex pairs and gold, where institutional order flow patterns are most consistent. They can technically apply to other markets, but thinner or less regulated markets may show less predictable behavior around these specific liquidity and structure concepts.
Disclaimer: This article is for educational and informational purposes only and does not constitute financial or trading advice. Trading forex, gold, and other leveraged instruments carries substantial risk of loss and is not suitable for all investors. Past performance and technical patterns described in this article do not guarantee future results. The Data Pips Team makes no guarantees regarding trading outcomes from applying the strategies described in this article. Always trade with capital you can afford to lose and consult a licensed financial professional before making trading decisions.